+7 (929) 727 53 60 Травматология / Ортопедия
Optical analysis of Implants from the Dura Mater. Спек-тральный анализ Раманов-ским методом имплантатов из ТМО (dura mater)
P. E. Timchenko, E. V. Timchenko, L. T. Volova, M. A. Nosova, O. O. Frolova, N. K. Kiyko and N. V. Volov
Samara National Research University, Russia; Samara State Medical University, Russia
e-mail: laser-optics.timchenko@mail.ru Received September 5, 2017; in final form, December 30, 2017. In modern dentistry, the problem of restoring the tissues of atrophied gums, both in the region of the exposed neck of the teeth, and in the case of adentia, is extremely urgent.
Presents the results of the spectral analysis using the method of Raman scattering spectroscopy (RS) of dura mater (DM) samples, manufactured by technology “Lioplast” practised in the clinic in the area of atrophic processes at multiple gum recessions. The method of Fourier deconvolution and selection of the spectral profile by the method of least squares is used to increase the resolution and informativity of the spectrum. With the help of mathematical methods of separation of overlapping spectral contours, the main bands corresponding to the main components of the implants were found: amides, proteins, glycosaminoglycans, DNA/RNA. On the basis of the two-dimensional spectral analysis, the coefficients reflecting the composition of the dura mater with different methods of its treatment were introduced. It has been established that Raman spectroscopy can be used to evaluate implants from the dura mater. Keywords: Raman spectroscopy, dura mater, biomaterial, spectral analysis, Fourier deconvolution, modeling of the spectral contour DOI: 10.3103/S1060992X18010101


In modern dentistry, the problem of restoring the tissues of atrophied gums, both in the region of the exposed neck of the teeth, and in the case of adentia, is extremely urgent [1].
According to different authors, the prevalence of gingival recession varies widely and amounts to 16–89% of all periodontal diseases [2].
To eliminate gum recessions in the world, the Zucchelli surgical method is recognized as a two-layer technique with the use of an autograft taken from a patient in the area of the hard palate [4].
However, the size of the autologous material limits the possibilities of treating patients with multiple gum recessions (in the region of 3 or more teeth).
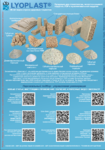
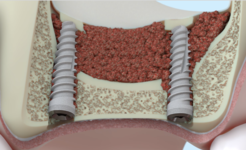
For the first time in the world practice, in this pathology, it is proposed to use the allogeneic dura mater (DM) of a human, made as the plastic material by the original domestic technology “Lioplast” ®. The use of dura mater, in this case, is the most profitable solution, since it can be used for multiple recessions.
The successful outcome of such operations depends on the quality and technology of production of materials, while preserving the necessary biological substances, such as collagen, glycosaminoglycans, proteoglycans [6, 15] and the removal of cellular components (DNA, RNA).
At present, the evaluation of bioimplants can be assessed in vitro using a set of morphological, morphometric, biochemical and optical methods of investigation, including Raman spectroscopy [6, 7].
Optical methods of biomaterial control at the modern level of development of science and technology, unlike destructive methods of analysis, have enough possibilities for successful solution of the problem, due to its simplicity, non-invasiveness and efficiency and the absence of additional sample preparation and cost-effectiveness [7].
Raman spectroscopy has certain advantages and allows real-time non-destructive, quantitative and qualitative analysis of the composition of biological objects and provides information on the molecular structure with high spatial resolution.
So in article [6] it is shown that this method is used to investigate spinal cord injuries.
Raman spectra showed distinct differences between damaged and healthy spinal cord.
Since implants made on the basis of the dura mater are a multicomponent complex, their RS bands can overlap each other.
Such overlap leads to a significant decrease in the information contained in the spectrum.
Therefore, in order to carry out a full-scale spectral analysis, it is necessary to apply mathematical methods for the decomposition of the spectral contour [16].
To separate such a complex into components and improve the resolution of bands in the Raman spectrum, Fourier deconvolution and spectral profile (spectrum modeling) methods can be used.
Purpose of the work: to study the composition of implants from the dura mater by the method of Raman spectroscopy using the methods of decomposition of the spectral contour at various stages of its production.
The subjects of the study were dura mater (DM) samples measuring 10 × 10 mm.
All samples were divided into 3 groups: 1 group-lyophilized, processed by the technology “Lioplast” ® (TU-9398-001- 01963143-2004) after radiation irradiation (sterile); 2 group – before sterilization (non-sterile) and 3 group – native samples.
In the process of production of bio-implants from the dura mater using the technology “Lyoplast” ®, at the first stage the process of obtaining implants includes special ultrasonic cleaning from antigenic structures for primary sterilization of the material and viral inactivation.
After the primary treatment, the tissues are lyophilized, and then the hermetically sealed material is finally sterilized by the radiation method at the final stage.
The use of chemical factors in the manufacture of used in the minimum amount to reduce allergic reactions and complications.
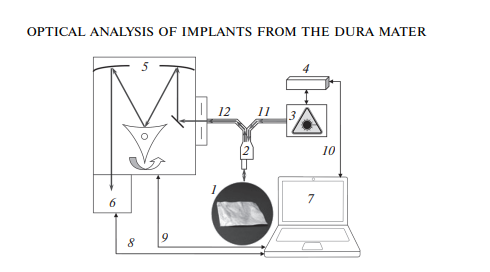
As the main method for the analysis of bioimplants, the Raman spectroscopy method was implemented using an experimental stand (Fig. 1), which includes a high-resolution digital spectrometer Shamrock sr-303i, combined with a LuxxMaster LML-785.0RB-04 laser module (power up to 500 mW, 785 nm wavelength) and built-in cooled DV420A-OE camera providing a spectral resolution of 0.15 nm (spectral range 200–1200 nm) [8].
The spectrums were taken from each side of the sample at five different spots.
The Raman probe 2 focused the laser radiation at object 1 (the spot diameter was 0.2 mm at a distance of 7.5 mm from the exit window of the tube), collected the radiation scattered by the object and focused the radiation filtered out in the spectral range 790–1200 nm onto the input end of the receiving optical fiber, through which it was transported to Input slit of the Shamrock sr-303i 5 spectrometer with built-in cooled chamber 6.
To reduce the noise level, the camera 6 matrix was cooled to –60°C, providing a spectral resolution of 0.15 nm (~1 cm–1).
Spectrum processing was carried out in the software environment Wolfram Mathematica 10 and consisted in removing the noise by a smoothing median filter of 7 points.
Then the selected range 300–2200 cm–1 using iterative algorithm [9, 10] the approximating line (the fifthdegree polynomial) of the auto-fluorescent component was determined and then this component was subtracted, obtaining a separate Raman spectrum.
The error of the coefficients used did not exceed 4% [11].then this component was subtracted, obtaining a separate Raman spectrum.
The error of the coefficients used did not exceed 4% [11].
3. EXPERIMENTAL RESULTS AND DISCUSSION


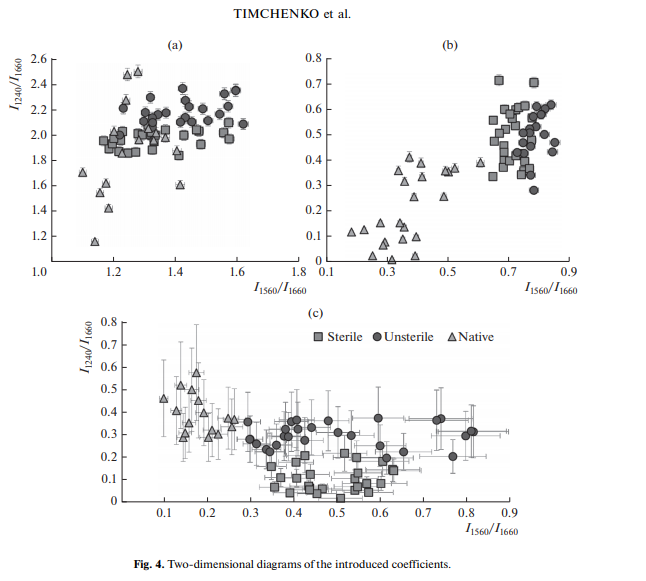
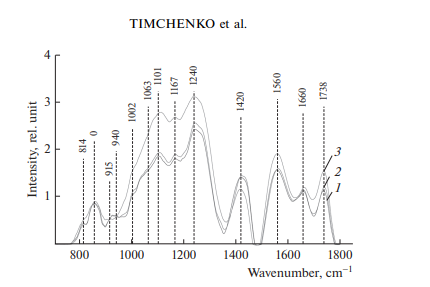
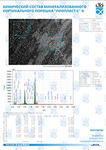
Figure 2 shows the characteristic averaged Raman spectra of groups of samples of the dura mater.
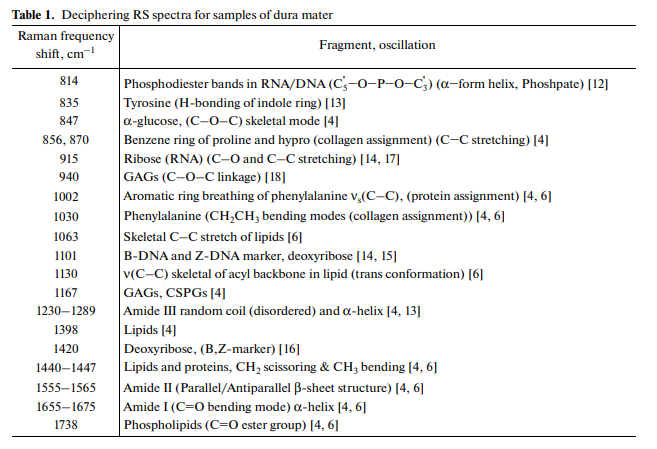
Analysis of the Raman spectra is presented in Table 1.
The differences appear in the Raman lines 814, 1002, 1101, 1167, 1240, 1420 and 1560 cm–1, Molecular vibrations of glycosaminoglycans, proteoglycans, phenyl assignment, deoxyribose (B, Z-marker), amide ΙΙΙ and amide ΙΙ (C–N–H valence) (deformation vibration of N–H) [4, 6, 12–16].
It can be seen from Fig. 2 that during processing, the line at the wave number of 1167 cm–1 is preserved in the samples, which indicates the preservation of glycosaminoglycans and proteoglycans (GAGs, CSPGs) during processing that play an important role in implant engraftment.
The collagen component, in addition to the CP lines of proline and hydroxyproline, is represented by amide ΙΙΙ groups (in the 1230–1289 cm–1 region), amide ΙΙ (in the 1555–1565 cm–1 region) and amide Ι (in the 1655–1675 cm–1 region), As well as a 1030 cm–1 Raman line corresponding to the CH2-CH3 vibrations of phenylalanine.
In addition, in all groups of samples, there is a Raman line at a wavenumber of 814 cm–1 corresponding to the phosphodiester linkage of DNA/RNA, which, possibly, indicates the destruction of nuclei and incomplete removal of DNA/RNA residues from the samples.
For sterile and non-sterile samples, the average correlation coefficient between the two groups is R12 = 99.42%, indicating that there is no noticeable destructive effect of sterilization by the radiation method on the implant.
The calculated correlation coefficient between the group of native samples and samples of the first, second group was R3 = 70.95%, which indicates a significant difference in the quantitative component of the composition.
Since the test samples have a multicomponent composition, the analysis of the RS lines corresponding to proteins and DNA based on the data in Fig. 2 is difficult without additional mathematical processing.
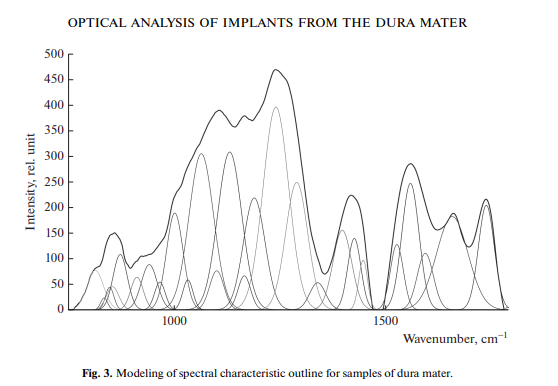
Therefore, using the method of selecting the spectral contour and deconvolution of the Gaussian function in the MagicPlotPro 2.7.2 software environment, nonlinear regression analysis of the spectral curve based on its fitting by the least squares method was performed, followed by expansion into spectral lines (Fig. 3).
As a trial function, the Gaussian function described by the function [21] was used: where: a is the amplitude, dx is full width at half maximum FWHM, x0 is the maximum position.
The criterion variable was the amplitude of the lines, which depends on the values of the independent variables (regressors) dx and x0, which determine the initial analysis conditions.
The average value of the determination coefficient of the resulting spectrum, modeled by trial functions, from the initial Raman spectrum in the range 750–1800 cm–1 is R2 = 0.997.
The degree of processing and quality of implants is determined by the complete removal of cellular components (DNA, RNA) and the preservation of the created extracellular matrix (EM), the main components of which are collagen, glycosaminoglycans, proteoglycans [6, 15].
The quality of the implant directly depends on the content of the components in it. Of greatest interest in the analysis of Raman spectra are the 835 cm–1 wave lines (Tyrosine), 855 cm–1 (proline), 940 and 1167 cm–1 (GAGs, CSPGs), 1240 cm–1 (amide ΙΙΙ), 1560 cm–1 (amide ΙΙ).
To control these parameters and more complete relative quantitative assessment of the component composition of the bioimplant surface on the basis of the dura mater, we introduced relative coefficients.
Relatively constant component in the studied samples of the dura was amide I [6], corresponding to the wave number of 1660 cm–1, therefore it was used as a denominator (I1660) in the introduced coefficients (k): where Ii is the intensity values at the wave numbers of the components being analyzed.
Figure 4 presents two-dimensional diagrams of the introduced coefficients, on which the differences between samples of different groups are seen.
It is also seen from Fig. 4a that the coefficients characterizing the relative concentration of amide ΙΙΙ and amide II for sterile samples are less than for non-sterile ones, indicating a small destructive effect of sterilization by the radiation method of Amide ΙΙΙ and Amide ΙΙ.
So for sterile specimens, the values (1.8 < I1240/I1660 < 2.1 and 1.16 < I1560/I1660 < 1.58) are characteristic, and for non-sterile samples (1.22 < I1560/I1660 < 1.61).
4. OPTICAL ANALYSIS OF IMPLANTS FROM THE DURA MATER
The values of the coefficients reflecting the relative concentration of glycosaminoglycans and proteoglycans, I940/I1660 and I1167/I1660, range from (0 < I940/I1660 < 0.4, 0.1 < I1167/I1660 < 0.6) for native and (0.3 < I940/I1660 < 0.7; 0.6 < I1167/I1660 < 0.9) for samples processed using the “Lioplast” technology (Fig. 4b), which reflects an increase in the relative concentration of GAGs, CSPGs with respect to collagen structures (amide I).
In the manufacturing process and indicates the preservation and production of a qualitative extracellular matrix, and for non-sterile samples, the values obtained were higher.
The ratio I856/I1660 shows the difference in the ratio of the peaks of benzene proline rings and the secondary structure of collagen I, caused by deformations in the collagen structure [20], and it makes it possible to clearly differentiate the native (0.1 < I856/I1660 < 0.26) Technology “Lyoplast” (0.93 < I856/I1660 < 0.85).
For the first and second group of samples, the values of the ratio I856/I1660 were in the same intervals.
From the analysis of the diagram 4c, it can be seen that the value of the optical coefficient I835/I1660 depends on whether the radiation was sterilized or not.
Thus, when using spectral analysis of Raman spectra with mathematical methods to improve the resolution of spectral contours for the evaluation of implants made on the basis of the dura mater, it is shown that when they are processed, components that negatively affect their quality are removed, while the required level of the extracellular matrix remains.
A comparative spectral evaluation of the component composition of the surfaces of implant samples based on the dura mater, manufactured using the “Lioplast” technology, carried out sterilization and without it, as well as native samples was carried out.
Deconvolution of spectra by the method of selection of the spectral contour and deconvolution of the Gauss function allows to carry out an expanded component qualitative and quantitative analysis of bioimplants on the basis of the dura mater of the main indices of biomatrix: collagens, proteins, glycosaminoglycans, proteoglycans, DNA/RNA It was established that the main differences are in the the wave numbers of 835 cm–1 (Tyrosine), 855 cm–1 (proline), 940 and 1167 cm–1 (GAGs, CSPGs), 1240 cm–1 (amide III), 1560 cm–1 (amide II).
The coefficients were introduced and a two-dimensional analysis was performed which showed that the processing retains the main components and removes DNA/RNA, which increases the quality of the material, which provides the possibility of a good clinical effect in the treatment of multiple gum recessions.
ACKNOWLEDGMENTS The reported study was funded by RFBR according to the research project no. 17-44-630343 р_а.
1. Muslimov, S.A., Morfologicheskie aspekty regenerativnoy khirurgii (Morphological Aspects of Regenerative Surgery), Ufa: Bashkortostan, 2000. 2. Ganja, I.R., Recession of the Gums, in Diagnostics and Methods of Treatment: A Manual for Doctors, Ganja, I.R., Modina, T.N., and Khamadeeva, A.M., Eds., Samara: Commonwealth, 2007. 3. Ferraro, J.R. and Nakamoto, K., Introductory Raman Spectroscopy, San Diego: Academic, 1994. 4. Chen, H., Xu, P.W., and Broderick, N., In vivo spinal nerve sensing in MISS using Raman spectroscopy, Proc. SPIE, 2016, vol. 9802, p. 98021L. doi 10.1117/12.2218783 5. Chen, J.L., Duan, L., Zhu, W., et al., J. Transl. Med., 2014, vol. 12, p. 88. https://doi.org/10.1186/1479-5876- 12-88. 6. Saxena, T., Deng, B., Stelzner, D., Hasenwinkel, J., and Chaiken, J., Raman spectroscopic investigation of spinal cord injury in a rat model, J. Biomed. Opt., 2011, vol. 16, no. 2, Article 027003. 7. Bazarnova, N.G., Karpova, E.V., Katrakov, I.B., et al., Methods of Studying Wood and Its Derivatives. Tutorial Text, Barnaul: Izd-vo Altai Gos. Univ., 2002 [in Russian]. 8. Timchenko, E.V., Timchenko, P.E., Volova, L.T., Pershutkina, S.V., and Shalkovsky, P.Y., Optical analysis of aortic implants, Opt. Mem. Neural Networks, 2016, vol. 25, no. 3, pp. 192–197. 9. Zhao, J., Lui, H., Mclean, D.I., and Zeng, H., Soc. Appl. Spectrosc., Bull., 2007, vol. 61, no. 11, pp. 1225–1232. 10. Timchenko, E.V., Timchenko, P.E., Volova, L.T., Dolgushkin, D.A., Shalkovsky, P.Y., and Pershutkina, S.V., Detailed spectral analysis of decellularized skin implants, J. Phys.: Conf. Ser., 2016, vol. 737, no. 012050, pp. 1–4. 11. Timchenko, P.E., Timchenko, E.V., Pisareva, E.V., Vlasov, M.Yu., Red’kin, N.A., and Frolov, O.O., Spectral analysis of allogeneic hydroxyapatite powders, J. Phys.: Conf. Ser., 2017, vol. 784, p. 012060. doi 10.1088/1742- 6596/784/1/012060 12. Thomas, G.J., Jr., Raman spectroscopy of viruses and protein-nucleic acid interactions, SPEX Speacker, 1976, vol. XXI, no. 4. 13. Ellis, D.I., Cowcher, D.P., Ashton, L., O’Hagana, S., and Goodacreab, R., Illuminating disease and enlightening biomedicine: Raman spectroscopy as a diagnostic tool, Analyst (Cambridge, U. K.), 2013, vol. 138, p. 3871. 14. Muntean, C.M., Halmagyi, A., Puiac, M.D., and Pavel, I., FT-Raman signatures of genomic DNA from plant tissues, Spectroscopy, 2009, vol. 23, pp. 59–70. doi 10.3233/SPE-2009-0375 15. Benevides, J.M., Overman, S.A., and Thomas, G.J., J. Raman Spectrosc., 2005, vol. 36, pp. 279–299. 16. Ruiz-Chica, A.J., Medina, M.A., Sanchez-Jimenez, F., and Ramirez, F.J., Characterization by Raman spectroscopy of conformational changes on guaninecytosine and adenine-thymine oligonucleotides induced by aminooxy analogues of spermidine, J. Raman Spectrosc., 2004, vol. 35, pp. 93–100. 17. Chan, J.W., Taylor, D.S., Zwerdling, T., Lane, S.T., Ihara, K., and Huser, T., Micro-Raman spectroscopy detects individual neoplastic and normal hematopoietic cells, Biophys. J., 2006, vol. 90, pp. 648–656. 18. Rudd, T.R.1, Hussain, R., Siligardi, G., and Yates, E.A., Raman and Raman optical activity of glycosaminoglycans, 2010, vol. 46, no. 23, pp. 4124–4126. doi 10.1039/c001535k 19. Motulsky, H.J. and Christopoulos, A., Fitting models to biological data using linear and nonlinear regression, in A Practical Guide to Curve Fitting, San Diego, CA: GraphPad Software Inc., 2003. 20. Lim, N.S., Hamed, Z., Yeow, C.H., Chan, C., and Huang, Z., Early detection of biomolecular changes in disrupted porcine cartilage using polarized Raman spectroscopy, J. Biomed. Opt., 2011, vol. 16, no. 1, p. 017003.
-
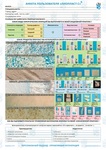
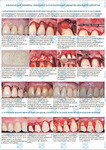
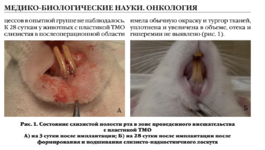
Создание экспериментальной модели in vivo для изучения хирургической техники в двуслойной методике лечения множественных рецессий
 Файл статьи Лабораторное исследование на животных. Использование аутотрансплантата и мембраны ТМО (dura mater) для лечения множественных рецессий десны. Сравнительный анализ результата.
Подробнее
Файл статьи Лабораторное исследование на животных. Использование аутотрансплантата и мембраны ТМО (dura mater) для лечения множественных рецессий десны. Сравнительный анализ результата.
Подробнее
-
Optical estimation of the composition of bone implants during processing
 ПодробнееФайл статьи P. E. Timchenko, El. V. Timchenko, L. T. Volova, O. O. Frolov, V. D. Meseyarakov, E. I. Pugachov, "Optical estimation of the composition of bone implants during processing," Proc. SPIE 11074, Diffuse Optical Spectroscopy and Imaging VII, 110741Q (11 July 2019); doi: 10.1117/12.2526343
 -
Chemometric analysis of bioimplants of bone tissues during their manufacture
 Файл статьи P. E. Timchenko, E. V. Timchenko, L. T. Volova, O. O. Frolov, "Chemometric analysis of bioimplants of bone tissues during their manufacture," Proc. SPIE 11363, Tissue Optics and Photonics, 113632A (2 April 2020); doi: 10.1117/12.2565723 Event: SPIE Photonics Europe, 2020, Online Only, FranceПодробнее
 -
Доклад на IV Международной научно-практической конференции «Современная гнатология»
 Файл анонса
М.А. Носова, Д.Д. Березина, Л.Т. Волова, А.Н. Шаров, Д.А. Трунин, М.А. Постников
Подробнее
Файл анонса
М.А. Носова, Д.Д. Березина, Л.Т. Волова, А.Н. Шаров, Д.А. Трунин, М.А. Постников
Подробнее


.jpg)