+7 (929) 727 53 60 Травматология / Ортопедия
Raman spectroscopy for evaluation of dura mater based grafts
P. Е Timchenko, Е. V Timchenko, L. Т Volova, О. О Frolov, А. U Kulabuhova, N. K Kiyko
1. Samara National Research University
2. Samara State Medical University
E-mail: laser-optics.timchenko@mail.ru


The results of comparative spectral evaluation of surface component composition of dura mater samples made by ”Lioplast” method using Raman spectroscopy are shown. The coefficients were implied and the two-dimensional analysis, showing that the treatment preserves the basic components and removes DNA/RNA, improving the quality of material, providing good clinical effect of multiple gingival recession treatment, was conducted.
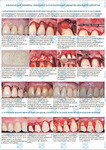
Gingival recession is common today; it causes the direct exposure of the teeth. The disease leads not only to esthetical problems, but also to all sorts of pathologies including enamel hypersensitivity, wedge-shaped defects, cavities, etc. [1]. The disease is relatively rare among young people (about 10%). It is more common among middle aged and elderly people (up to 95%). There is only surgical treatment of gingival recession. The surgery aims to restore the perfect gum contour and to close the exposed roots of the affected teeth completely [2]. In 2000 Zucchelli and DeSanctis described the method of simultaneous correction of several recessions using coronally advanced flap. This method implies raising the envelope flap using lateral or frontal approach without vertical releasing incisions, which is subsequently coronally repositioned to cover the recessions [3]. One way of dealing with the gingival recession is using the allogenic human dura mater made by original Russian “Lioplast®” method (TU-9398-001-01963143-2004) as plastic material. In this case using dura mater is the best decision because it can be used for treating multiple recessions. The success of such surgeries depends on the material quality and technologies of its production maintaining the necessary biological components such as collagens, glycosaminoglycans, proteoglycans. At the current state of Science and Technology the optical methods of biomaterial control have a lot of capabilities to succeed in solving the problem because it is simple, non-invasive and prompt, as well as there is no additional sample preparation and it is cost-effective, unlike the destructive analysis methods [4, 5]. The Raman spectroscopy has certain advantages and allows real-time conduction of nondestructive, quantitative and qualitative analysis of biological object composition and provides information about molecular structure with high spatial resolution. Thus it is shown in the article [6] that this method is used to research the damaged spinal cords. The Raman spectra showed the obvious distinctions between damaged and healthy vertebrae. The aim of this work is using the Raman spectroscopy method for estimation of the dura mater based grafts.
MATERIALS AND METHODS OF RESEARCH
The Raman spectroscopy method implemented with the use of the experimental stand including the Raman probe RPB-785 (focal length 7.5 mm) combined with the laser module LuxxMaster LML785.0RB-04 (power up to 500 mW, wavelength 784.7 ± 0.05 nm) and high-resolution digital spectrometer Shamrock sr-303i providing spectral resolution of 0.15 nm with the built-in cooling chamber DV420A-OE [7, 8] (spectral range 200-1200 nm) was used as the main method of graft analysis. The spectra were taken from each sample in seven different points. The subjects of the research were 12 samples of dura mater 10*10 mm in size. All samples were divided into two groups: the first group was treated by ultrasound (UN); the second group was formed by the samples without ultrasonic treatment (BN).In the process of production of grafts from the dura mater by "Lioplast®" method, the first stage of graft production includes the special ultrasonic cleaning from antigenic structures for primary sterilization of the material and its viral inactivation. After the primary processing the tissues were freeze-dried, and then the hermetically packed material was radiation sterilized. The chemical factor applications were minimal in order to reduce allergic reactions and complications. The spectra were processed in Wolfram Mathematica 10 software. The processing included the noise removing using the ripple median filter over seven points. Then with the use of iteration algorithm [9] the approximation line (seventh order polynomial) of autofluorescent component was determined at the chosen interval of 300-2200 cm-1 , and then this component was subtracted, receiving the selected Raman spectrum. The error of the used coefficients did not exceed 4% [10]. The method of spectral contour modelling that increased the spectrum informativeness was implemented in MagicPlotPro 2.7.2 software, where spectra were decomposed to the lines described by the Gaussian function [11].

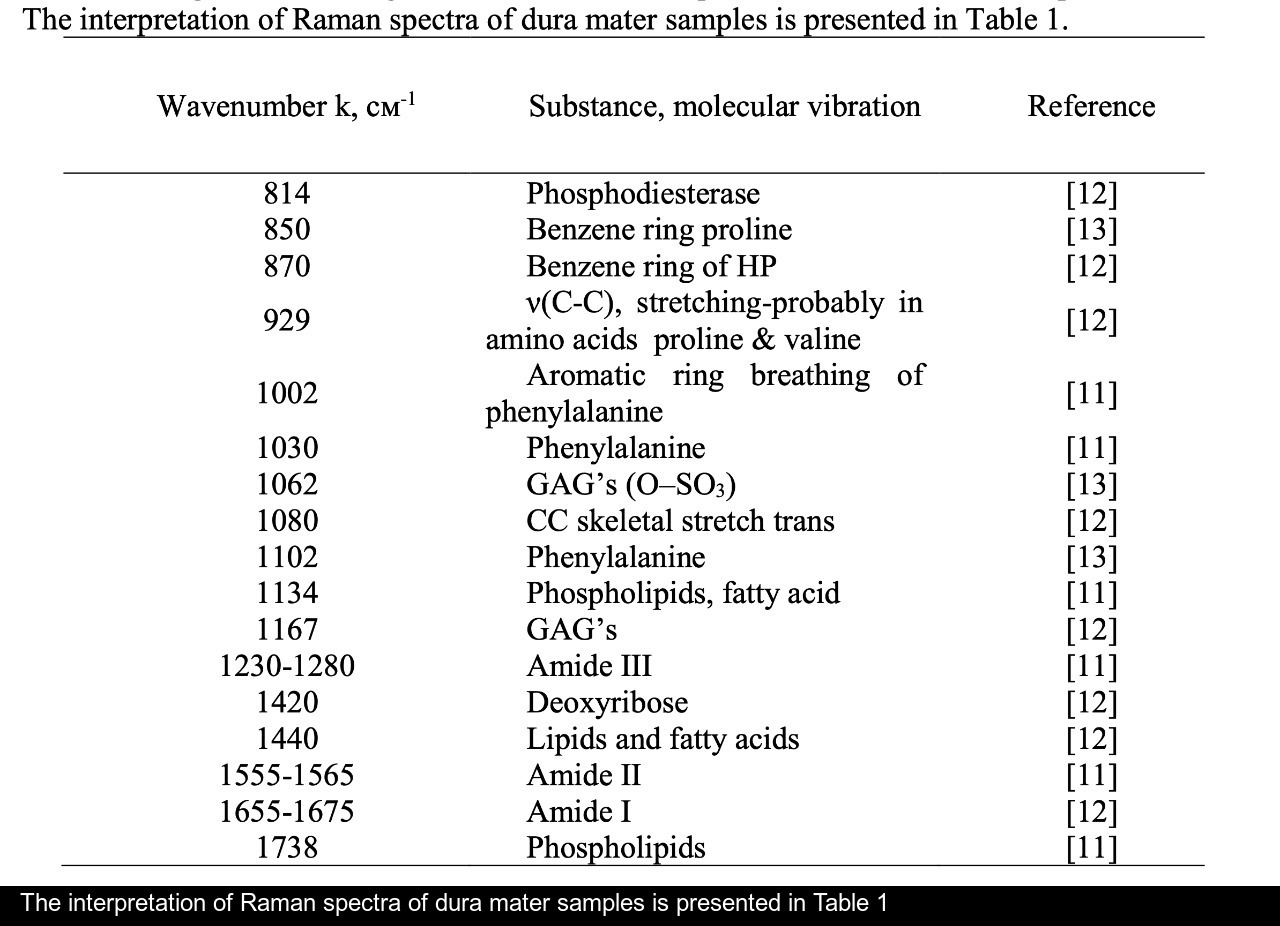
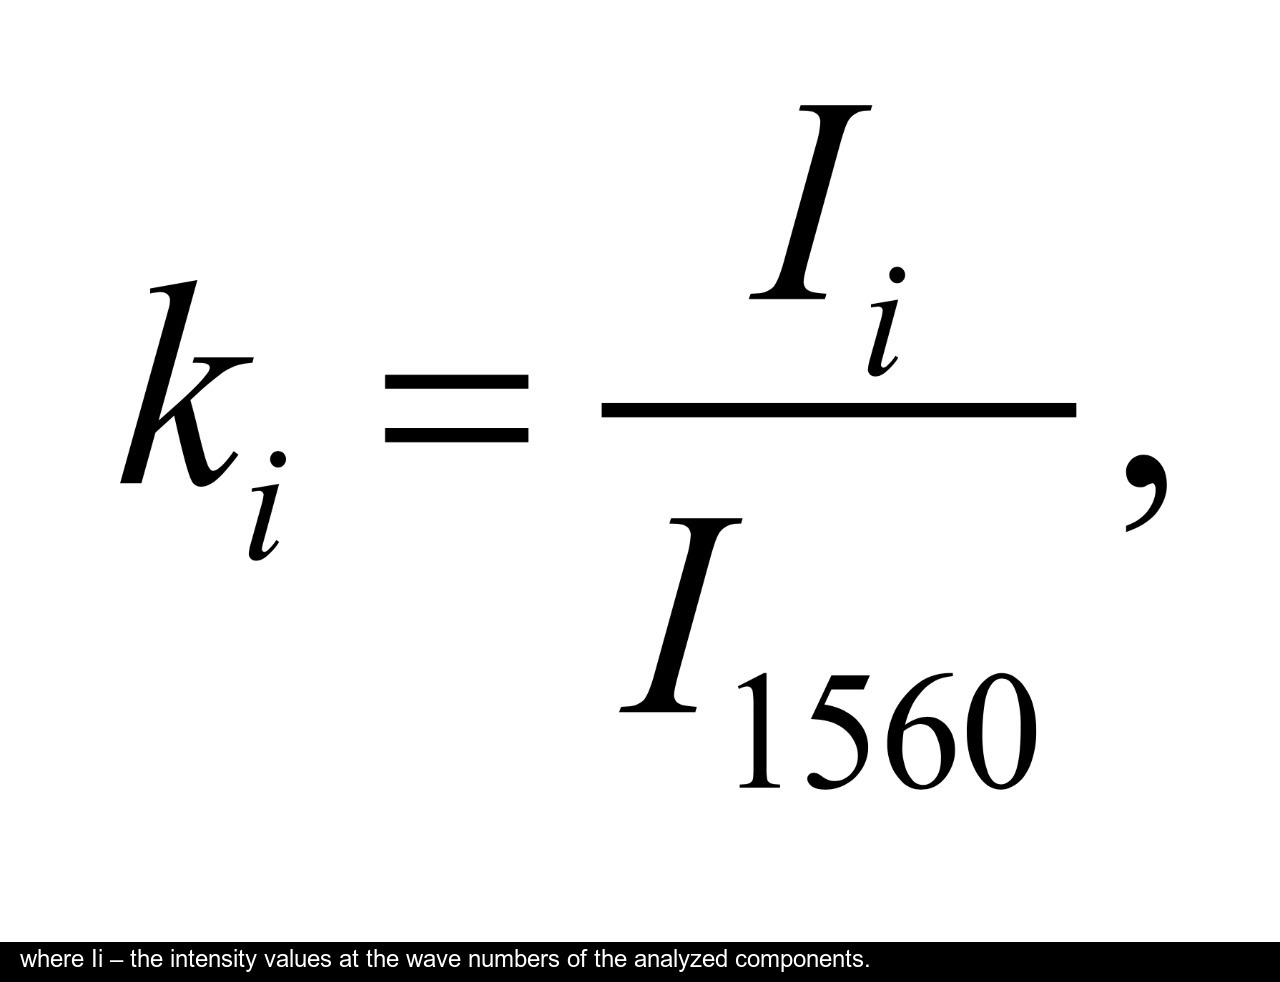

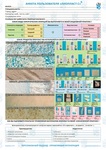
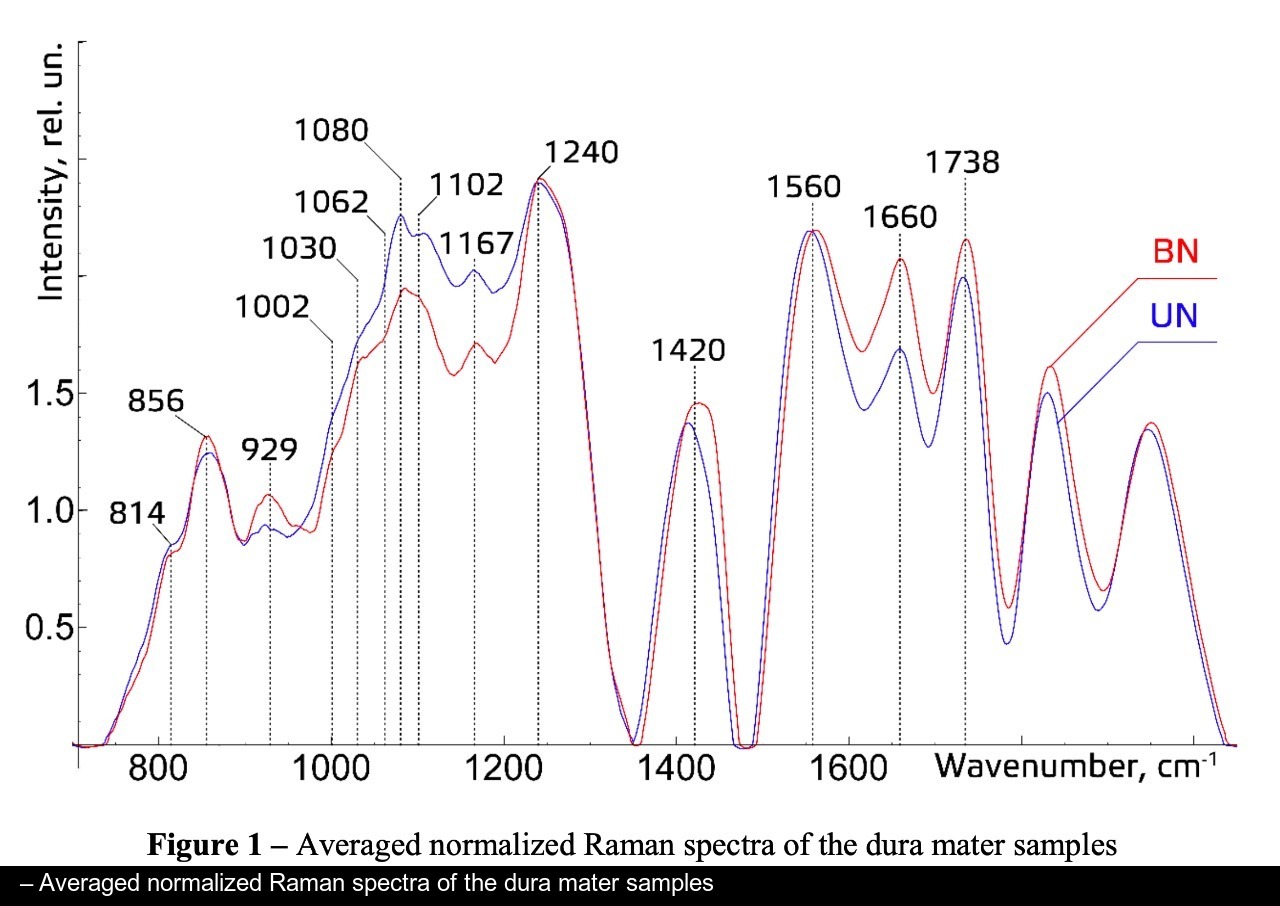
The typical Raman spectra of two groups of dura mater samples averaged over 12 samples in the wavenumber region of 750-2000 cm-1 are shown in Figure 1. The main differences appear at the Raman spectra lines 929 cm-1 , 1002 cm-1 , 1030 cm-1 , 1080 cm-1 , 1102 cm-1 , 1167 cm-1 , 1660 cm-1 and 1738 cm-1 . The line intensity corresponding to phospholipids (1738 cm-1 ) decreases during processing, this indicates the influence of ultrasonic treatment on the biomatrix component. Apart from the Raman lines of proline and hydroxyproline the collagen component includes the groups of amide III (in the range of 1230-1280 cm-1 ), amide II (in the range of 1555-1565 cm-1 ) andamide I (in the range of 1655-1675 cm-1 ), as long as the Raman lines 1002, 1030 and 1102 cm-1 , that correspond to phenylalanine fluctuation. All groups of samples also include the Raman lines at the wavenumber 814 cm-1 , corresponding to phosphodiester bond of DNA/RNA, possibly indicating nucleus destruction and incomplete DNA/RNA removal from the samples. The relatively permanent component of the researched dura matter samples was amide II [14] (Fig. 1), corresponding to the wavenumber 1560 cm-1 , therefore the amplitude of this divided line was used as a denominator (I1560) in the introduced coefficients (k):
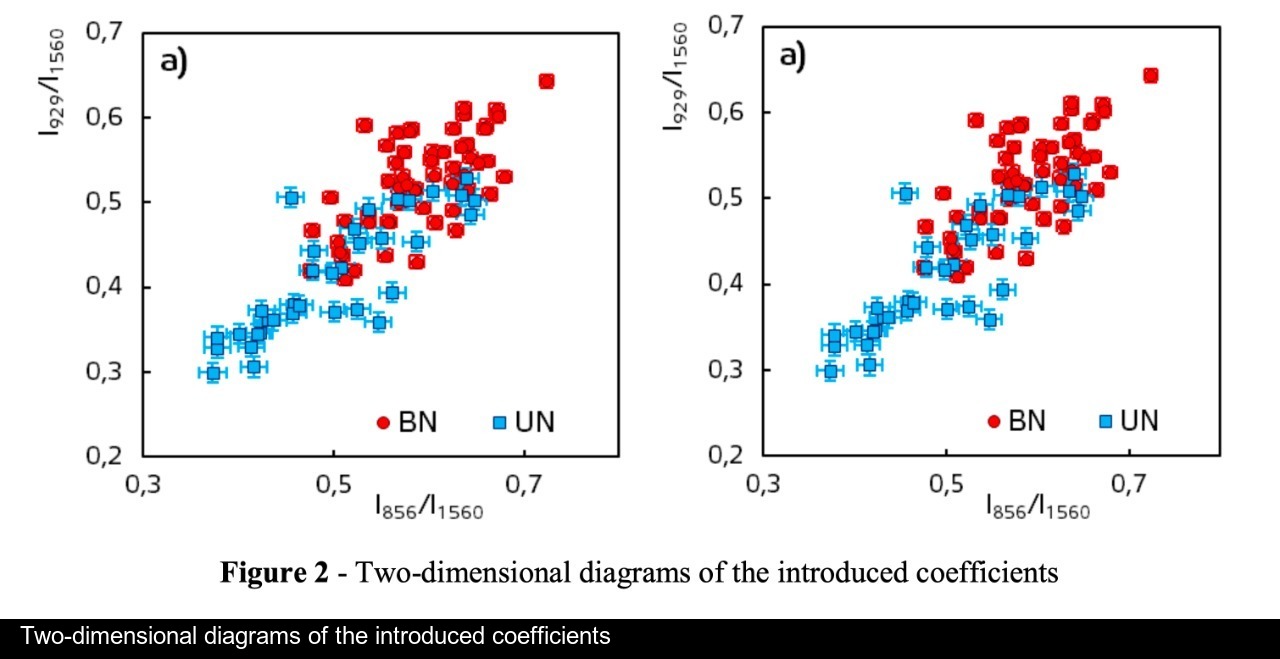
A two-dimensional analysis of the introduced coefficients was carried out.
The 2a two-dimensional diagram analysis shows that coefficients I856/I1560 and I929/I1560 depend on whether the ultrasonic treatment was conducted or not, and indicate that for the UN first group samples lower proline concentration is typical. The Figure 2b shows the optical coefficients k1102, k1030 indicating relative concentration of phenylalanine in collagen and proteins of the dura mater biomatrix. It can be concluded that the differences between the two groups are minimal, i.e. the ultrasonic treatment does not affect the phenylalanine concentration.
The comparative spectral evaluation of surface component composition of dura mater graft samples made by ”Lioplast” method with ultrasonic treatment and without it was conducted. It was determined that the main differences occurred at the wavenumbers 1440, 1738, 1660 cm-1 (lipids & fatty acid), 856 and 929 cm-1 (proline), 1062 and 1167 cm-1 (GAG, CSPG), 1204 cm-1 (tyrosine). The coefficients were implied and the two-dimensional analysis, showing that the treatment preserves the basic biomatrix components and provides good clinical effect of multiple gingival recession treatment, was conducted.
The reported study was funded by RFBR according to the research project № 17-44-630343 р_а
-
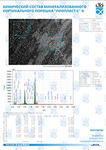
Analysis of the mineral component for cortical bone tissue by Raman spectroscopy after ovariectomy and its treatment with allogeneic hydroxyapatite
 Файл статьи E. Timchenko1, P. Timchenko1, E. Pisareva1, M. Vlasov2, L. Volova2, I. Fedorova1, A. Tumchenkova1, M. Gorchenkova1 and A. Subatovich1Подробнее
 -
Research of component composition of bioimplants for treatment of gum recession using a Raman spectroscopy method
 Файл статьи P. Е. Timchenko1, Е. V. Timchenko1, L. Т. Volova2, О. О. Frolov1 and E. F. Yagofarova1Подробнее
 -
Raman spectroscopy method for the evaluation of bone bioimplants made using the "Lyoplast" technology from cadaveric and in vivo resected bone tissue
 Файл статьи P. Е Timchenko1, Е. V Timchenko1, L. Т Volova2, D. А Dolgushkin , V. V Boltovskaya , О. О Frolov1Подробнее
 -
Raman spectroscopy for evaluation of dura mater based graft
 Файл статьи P. Е Timchenko, Е. V Timchenko, L. Т Volova, О. О Frolov, А. U Kulabuhova, N. K KiykoПодробнее