+7 (929) 727 53 60 Травматология / Ортопедия
Research of component composition of bioimplants for treatment of gum recession using a Raman spectroscopy method
P. Е. Timchenko1, Е. V. Timchenko1, L. Т. Volova2, О. О. Frolov1 and E. F. Yagofarova1
1.Samara National Research University, 443086, Russia, Samara, Moscow highway, 34
2.Experimental Medicine and Biotechnologies Institute of the Samara State Medical University, 443099, Russia, Samara, Chapaevskaya Street, 89 E-mail: laser-optics.timchenko@mail.ru

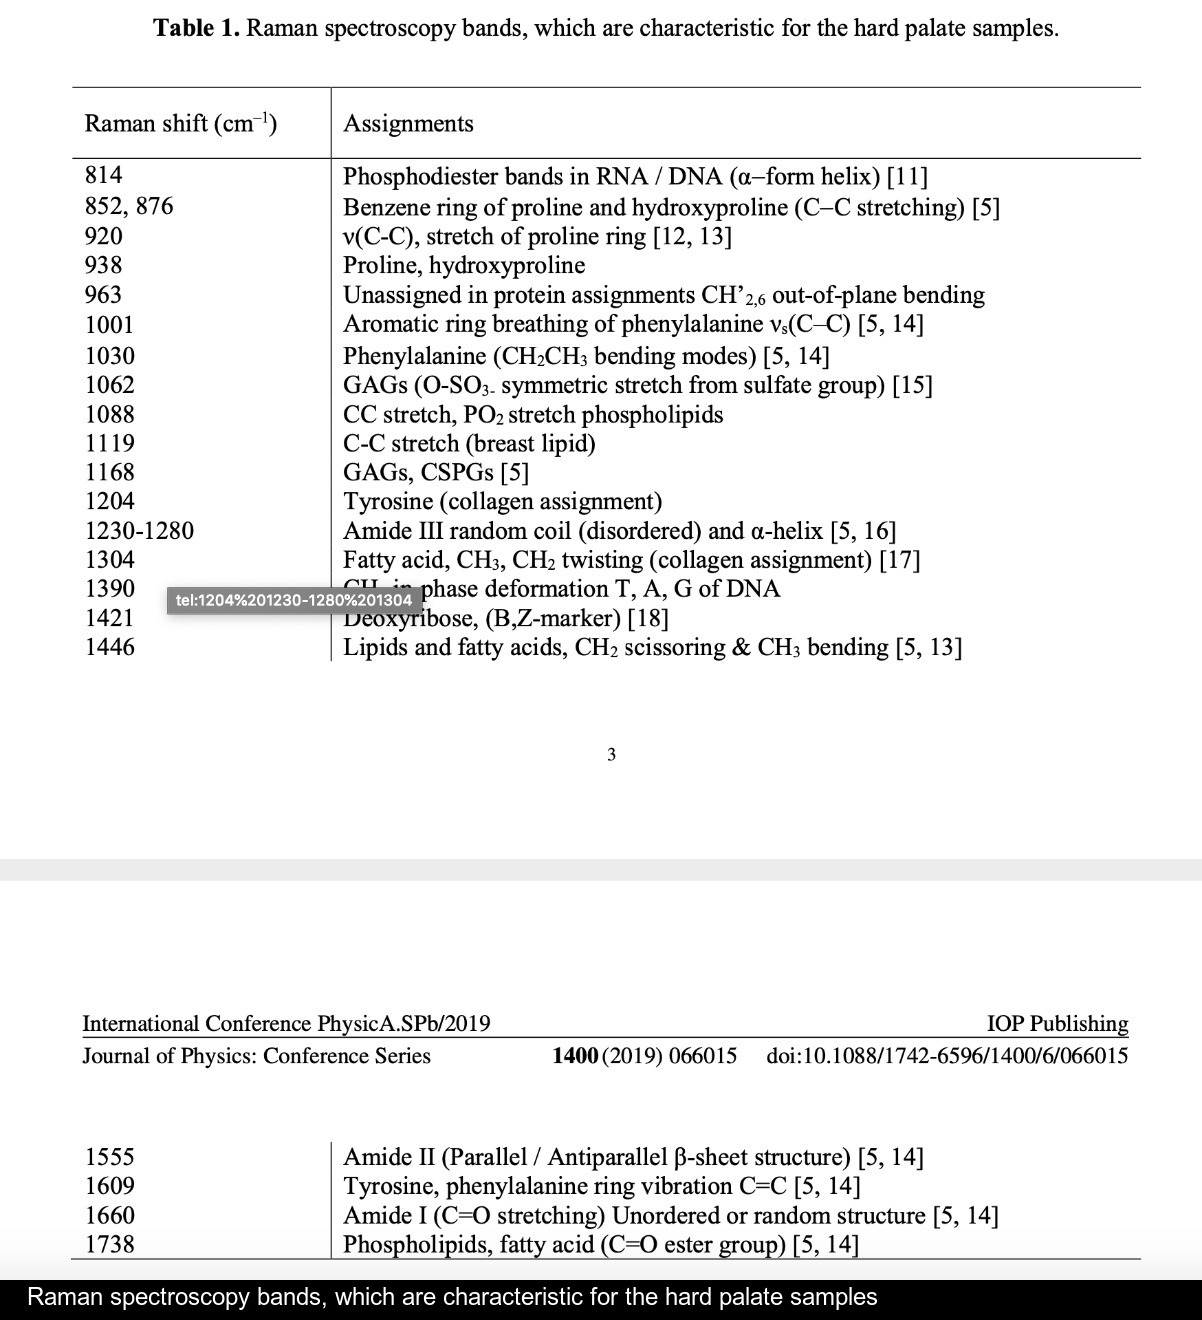

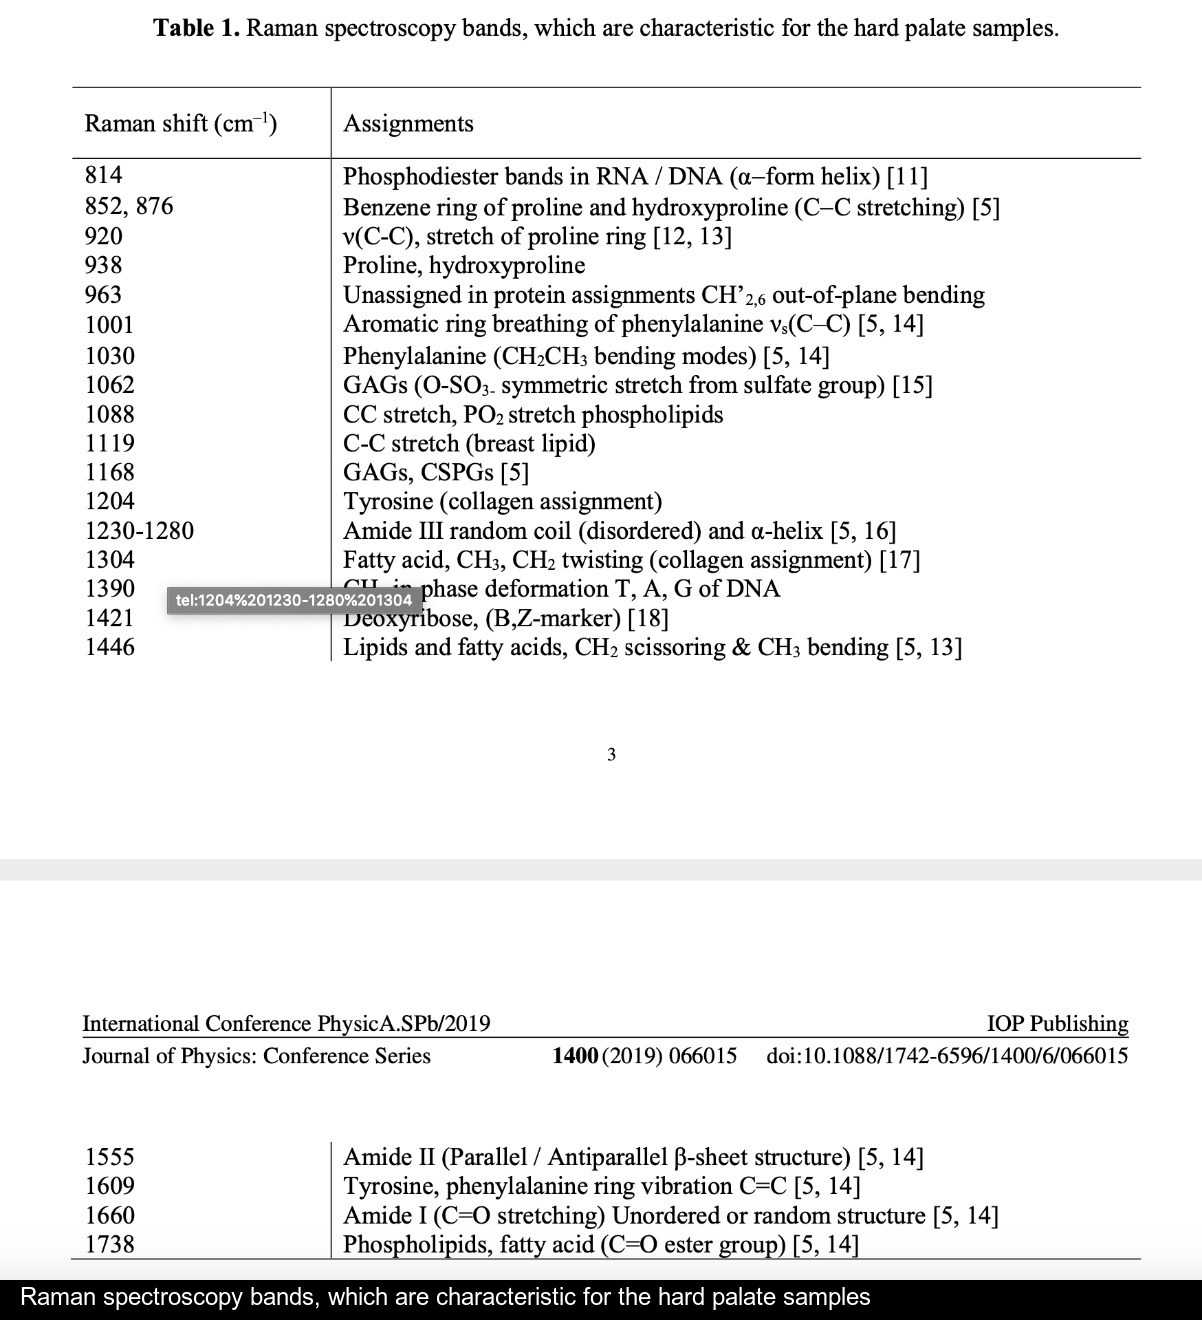
Research of component composition of bioimplants for gum recession treatment using the Raman spectroscopy method is presented in this paper. Spectral assessment of the component composition of hard palate bioimplants prepared by the «Lioplast» technology before and after lyophilisation is carried out. Expanded component analysis of the researched objects using the deconvolution method shows that the difference in relative component composition of the two groups of samples is seen at wavenumbers of 1446, 1738, 1660 cm-1 (lipids & fatty acid), 852 and 938 cm-1 (proline), 1062 cm-1 (GAGs), 1204 cm-1 (tyrosine), 1555 cm-1 (amide II). The criteria that allow assessing the composition and quality of the prepared bioimplants are given on the base of spectral analysis. It is shown in the paper that the developed optical method of biomaterial assessment can be used for the process optimization and to select individual processing parameters.
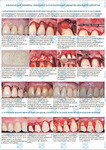
The problem of restoring receding gum tissues, both in the area of bare necks of teeth and in adentia, is extremely relevant in modern dentistry [1]. According to different authors, the incidence of gum recession varies widely and is 45.5-99.3 % of all periodontal diseases. The universally recognized method of gingival recession treatment is the Zucchelli's surgical technique - a two-layer method using an autograft taken from patient's hard palate [2]. However, the size of automaterial limits the treatment of patients with multiple gingival recessions (in the area of 3 or more teeth). The biomaterials made using the techniques presented in [1] are currently used for treatment of gingival recession. Disadvantage of these techniques is incomplete engraftment of bioimplants. One of the most optimal techniques of bioimplant manufacturing for the use in dentistry is the technology of "Lioplast"® (Russia, Samara). To optimize the process of bioimplant manufacturing and to select individual processing parameters the optical methods of biomaterial control, in particular the Raman spectroscopy (RS) method, can be used. The RS method allows controlling the component composition of biomaterials and has a number of advantages, such as an ease of sample preparation, minimal invasiveness, large amount of information obtained and efficiency of study [3, 4]. Raman bands can overlap each other because bioimplants are multicomponent. Such overlapping causes significant reduction of spectral information. Therefore, mathematical methods of decomposition of spectral contour are necessary for full spectral analysis [5, 6]. Fourier-deconvolution and spectral profile selection (spectrum modeling) methods can be used to divide such multicomponent set into components and improve the resolution of bands in the Raman spectrum. The aim of the work is estimation of composition for the hard palate bioimplants at the different stages of the bioimplant manufacture using Raman spectroscopy and the spectral contour decomposition methods.
MATERIALS AND METHODS OF RESEARCH
Lyophilized and non-lyophilized samples of bioimplants of palate prepared by the technology of «Lioplast»® (ТУ-9398-001-01963143-2004) are the study materials. The palate samples were studied using RS stand. The stand includes a high-resolution digital spectrometer Sharmrock SR-303i with an integrated digital camera DV420A-OE (the spectral range of 200-1200 nm), a fiber-optic probe RPB-785 for Raman spectroscopy, combined with laser module LuxxMaster LML-785.0RB-04 with wavelength of 785 nm and linewidth of 0.2 nm [7, 8]. The RS processing was conducted using software Wolfram Mathematica 9. The researched spectrum was cleared up from noises by the smoothing median filter (5 points), the approximation line (a fifth order polynomial) of autofluorescent component was determined in the chosen interval of 700- 2200 cm-1 using an iteration algorithm [9], then this component was subtracted and as a result the selected Raman spectrum was received [10].
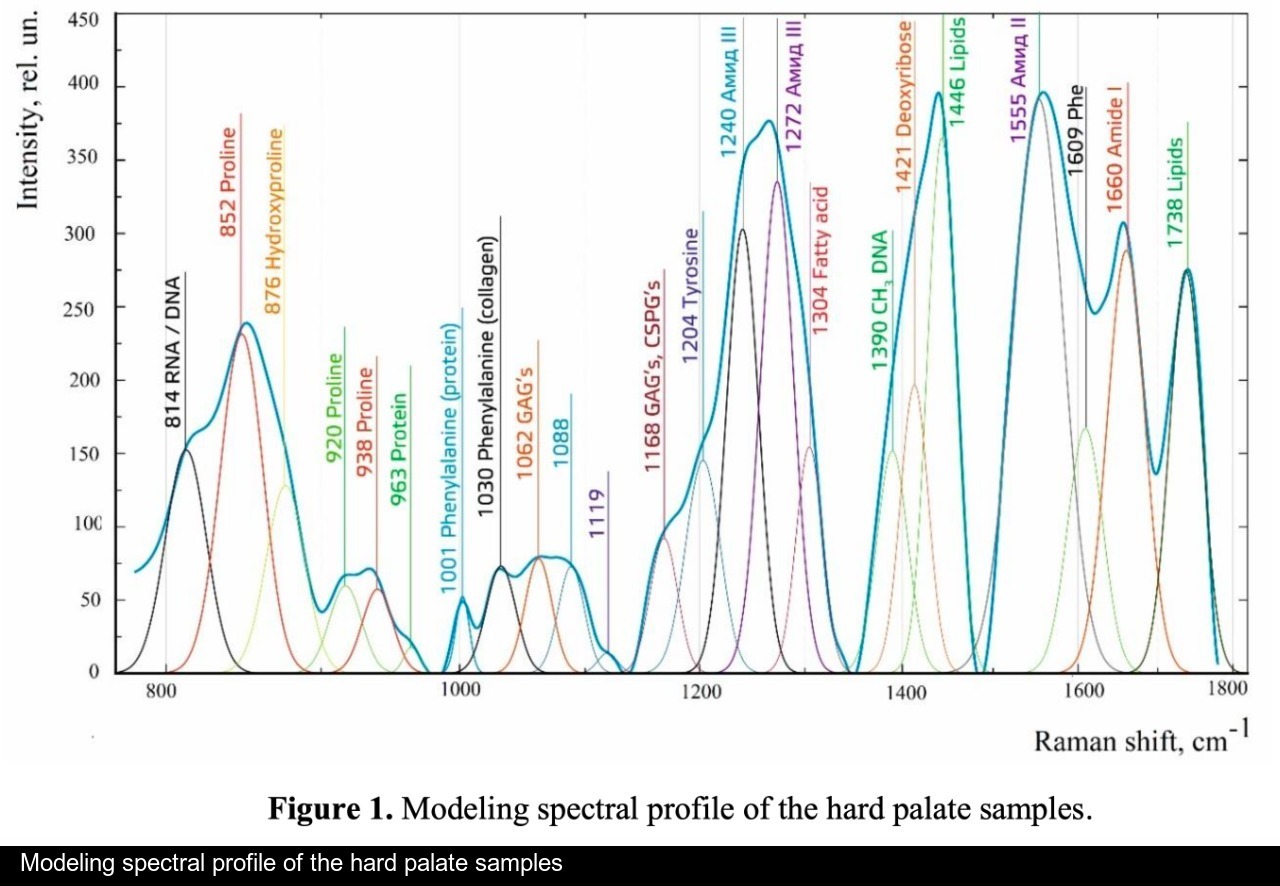


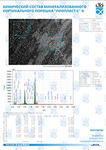
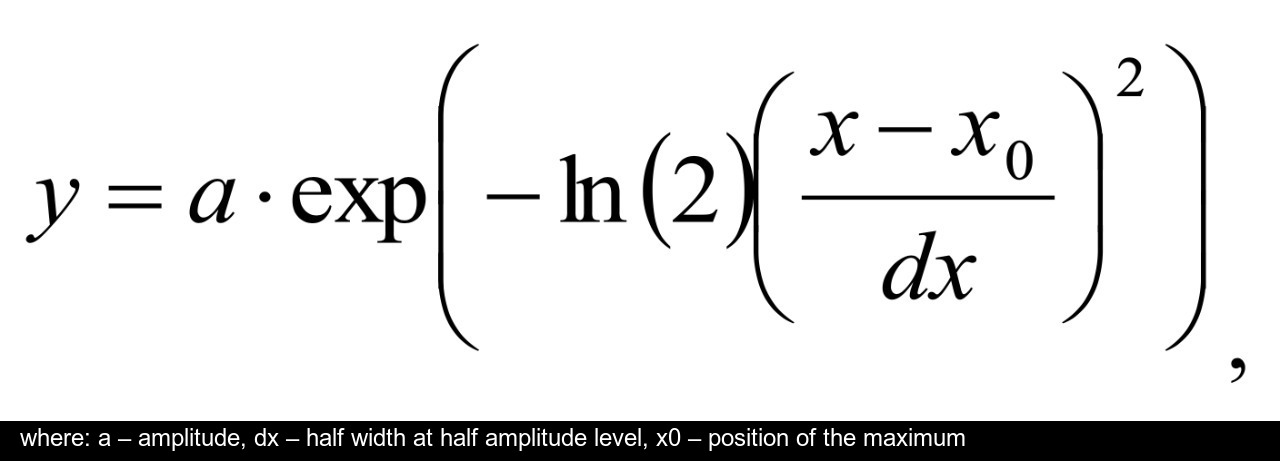
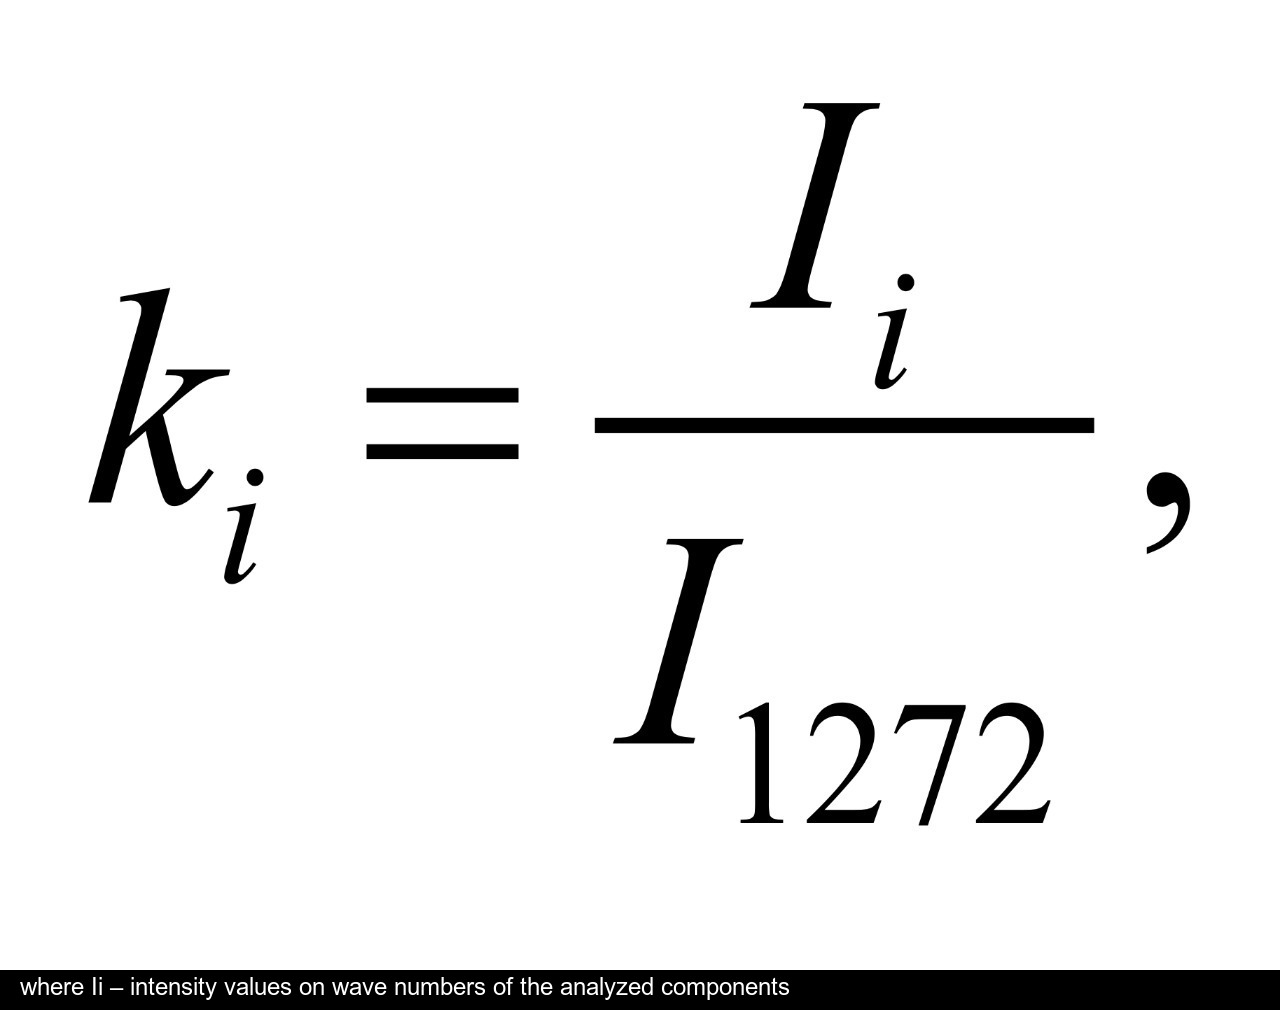
Spectrum deconvolution using the method of the spectral contour selection and chemometric analysis using principal component method (PCA) allows conducting advanced component qualitative and quantitative analysis of dura mater bioimplants by the amount of the main biomatrix indicators: collagens, proteins, glycosaminoglycans, proteoglycans, DNA / RNA and establishing the most representative parameters affecting the quality of implants during the rapid assessment. Non-linear regression analysis of the RS spectra including its decomposition into spectral lines (Figure 1) was carried out using the method of spectral profile selection and deconvolution of the Gauss function using software MagicPlotPro 2.7.2.We have used the trial Gauss function described by the formula [10]: The criteria-based variable is the line amplitude depending on independent variables (regressors) dx and x0 that determine the initial conditions of the analysis. The average value of the coefficient of determination of the resulting spectrum made using trial functions from the initial Raman spectrum in the range of 750-2050 cm-1 is R2 = 0.997. The degree of processing and the quality of the implants is determined by fullness of cell component (DNA, RNA) removing and preservation of the extracellular matrix (EM), the main components of which are collagen, glycosaminoglycans, lipids [4, 5]. The quality of the implant depends on the content of these components. We have introduced relative coefficients to control these parameters and for more complete relative quantitative assessment of component composition of the dura mater bioimplants. A relatively constant component in the studied samples was amide III [4], corresponding to the region of wavenumbers of 1230-1280 cm-1 , so the amplitude of the divided line of amide III was used as a denominator (I1272) in the introduced coefficients (k):
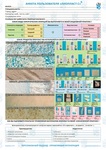
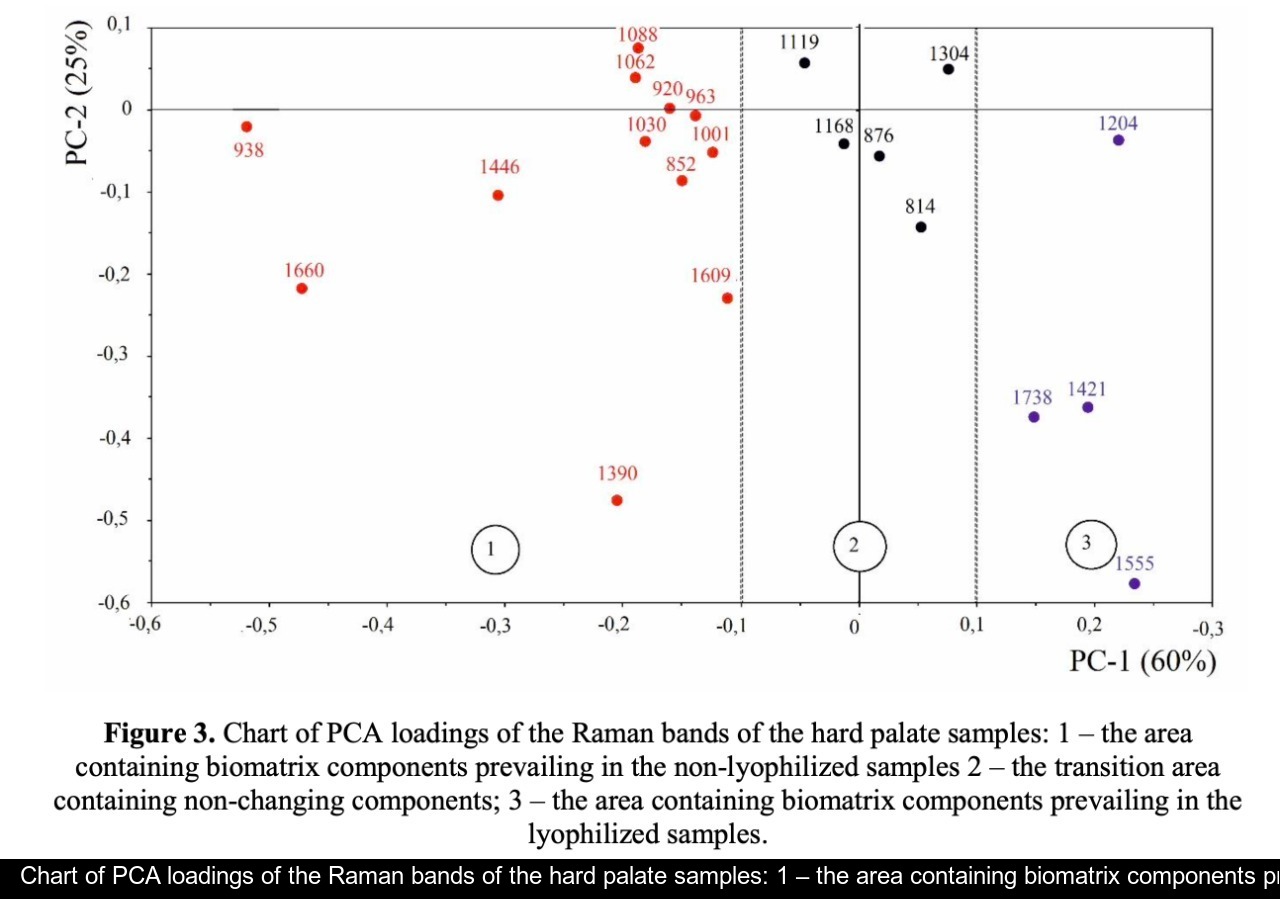
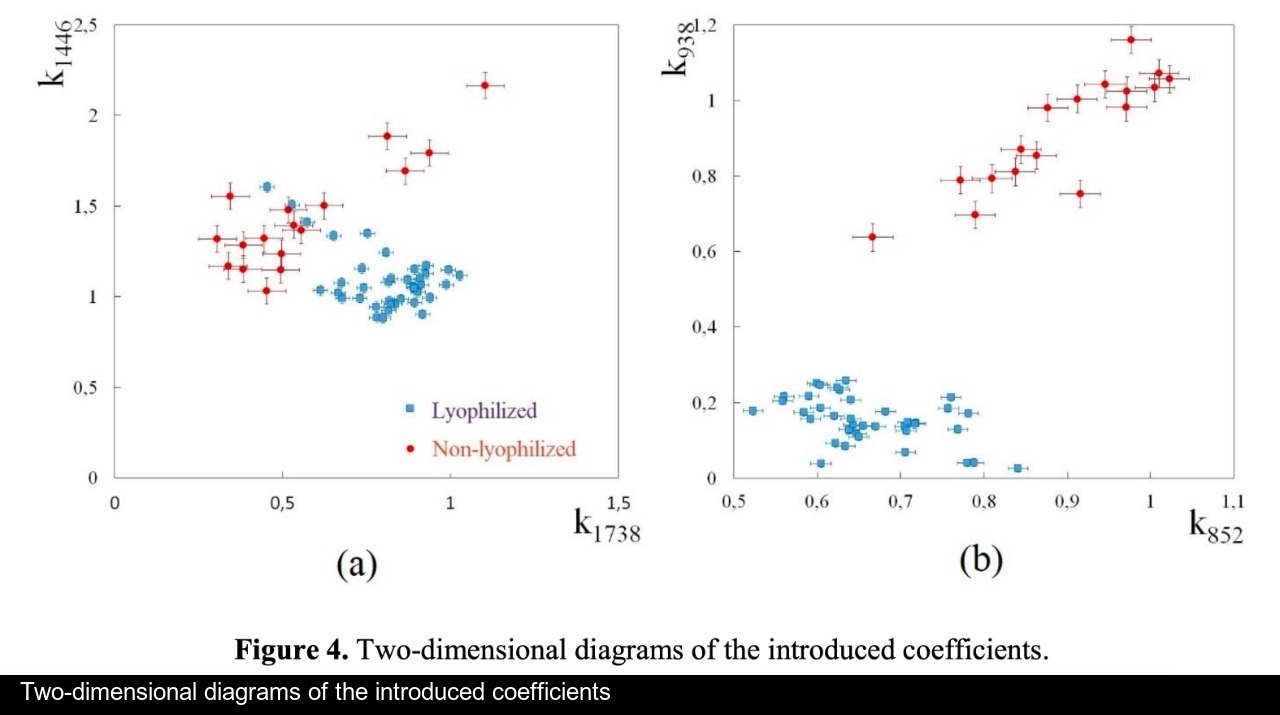
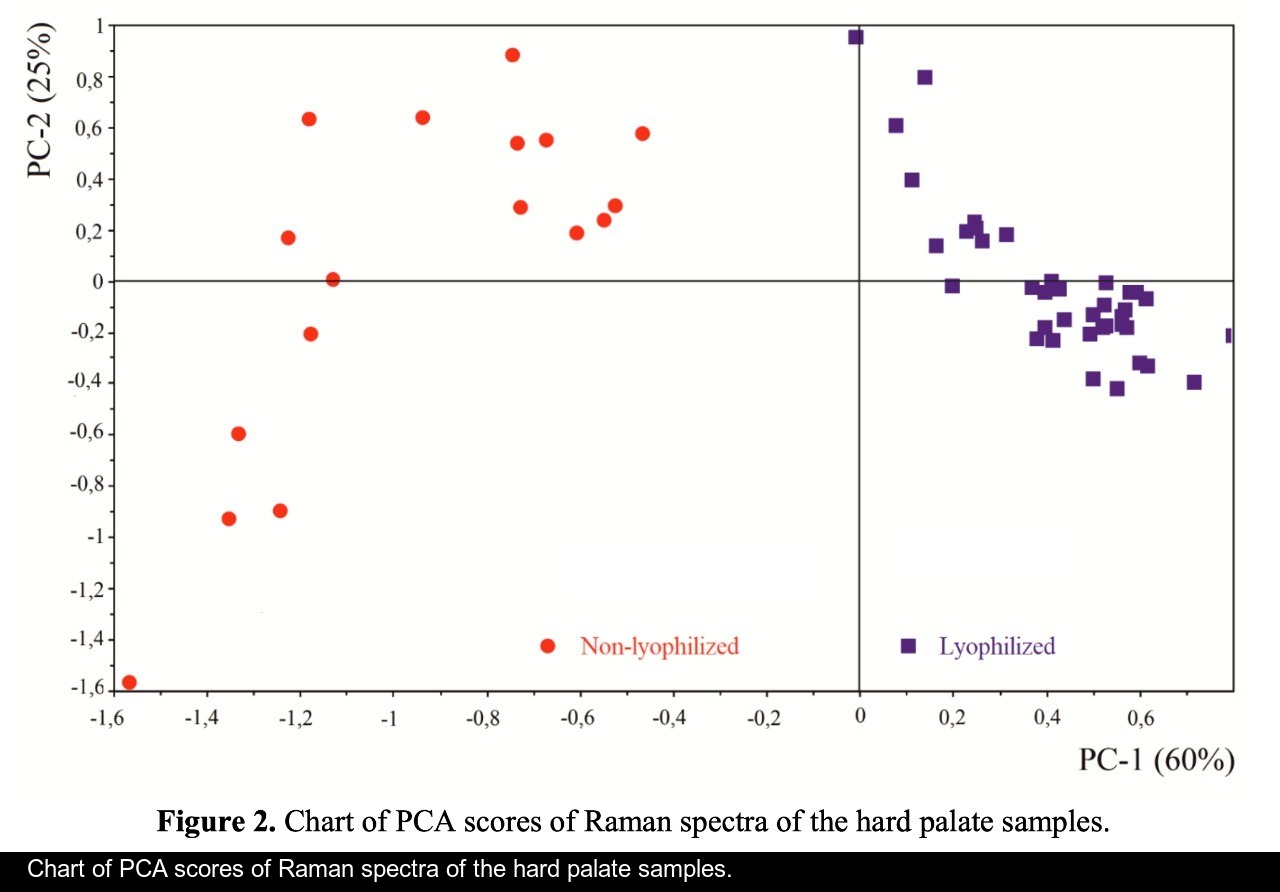
The Figure 2 shows that principal component PC-1 describes the main difference between the two groups. The positive value of PC-1 is characteristic for the lyophilized samples, and on the other hand, negative value is characteristic for the non-lyophilized samples. The analysis of the Raman spectroscopy bands is presented in the table 1. We can conclude according to the figures 2 and 3 that the major difference between the groups of samples is described by the coefficients indicating the relative intensity of the Raman lines on the wave numbers: 852 and 938 cm-1 (proline), 1001 and 1030 cm-1 (phenylalanine), 1062 cm-1 (GAG’s), 1088 cm-1 (phospholipids), 1390 cm-1 (DNA), 1446 cm-1 (lipids and fatty acids), 1660 cm-1 (amide I). These variables have higher values for the non-lyophilized samples. The lyophilized samples with ultrasound processing are characterized by the higher value of the variables belonging to the area 3: 814 cm-1 (RNA/DNA), 1204 cm-1 (tyrosine), 1421 cm-1 (deoxyribose), 1555 cm-1 (amide II), 1738 cm-1 (phospholipids, fatty acid). Meanwhile, the higher the value of PC-1 is, the higher influence it has on the difference of component composition, which is seen in the value of coefficient k1660. Figure 3 shows that intensity of the Raman band of 1660 cm-1 corresponding to the vibrations of amide I is higher for the nonlyophilized samples. Therefore, the data field in the Figure 3 has been divided into three areas, where the second one is a transition region containing the biomatrix components that do not change during the processing and are characteristic for the both groups. The detailed two-dimensional analysis of the introduced coefficients showing the difference and similarity between the two groups of samples is given in the Figure 4. The Figure 4a shows the characteristic areas of the sample groups. We can see that on average the k1738 coefficient determining the relative concentration of phospholipids is higher for lyophilized samples than for the group of samples without treatment. However, the k1446 coefficient determining the relative concentration of collagen lipids that are characteristic for non-liophilized samples is higher than for lyophilized samples, which may be caused by the residual (less than 1%) concentration of lipids and fats, due to their incomplete removal. The Figure 4b shows that the relative concentration of proline is higher for untreated samples than for lyophilized samples. Therefore the use of Raman spectra analysis with mathematic methods of improving the spectral contour resolution and chemometric analysis using PCA for implant estimation has shown that the implant treatment removes the components that negatively affect their quality; at the same time the necessary amount of extracellular matrix: glycosaminoglycans, collagens, prolines, hydroxyprolines and phenylalanines having an important role in the process of engraftment of bioimplants and in receiving high-quality extracellular matrix remains the same.
Comparative spectral estimation of the component composition of hard palate samples of bioimplants made by «Lioplast» method with and without lyophilization treatment is shown. Major spectral differences, occurring at wave numbers 1446, 1738, 1660 cm-1 (lipids & fatty acid), 852 and 938 cm-1 (proline), 1062 cm-1 (GAGs), 1204 cm-1 (tyrosine), 1555 cm-1 (amide II), were identified. The criteria that allow estimating the preservation of the main biomatrix components after processing of different degree were suggested. Using the criteria allows raising the quality of the material providing a good clinical effect during regenerative processes. The developed optical method of biomaterial estimation according to the values of spectral ratio can be used for the process optimization and to select individual processing parameters.
The research was carried out with support of Russian Foundation of Basic Research, project 18-32- 00004
-
Raman spectroscopy method for the evaluation of bone bioimplants made using the "Lyoplast" technology from cadaveric and in vivo resected bone tissue
 Файл статьи P. Е Timchenko1, Е. V Timchenko1, L. Т Volova2, D. А Dolgushkin , V. V Boltovskaya , О. О Frolov1Подробнее
 -
Raman spectroscopy for evaluation of dura mater based graft
 Файл статьи P. Е Timchenko, Е. V Timchenko, L. Т Volova, О. О Frolov, А. U Kulabuhova, N. K KiykoПодробнее
 -
Хирургическое лечение множественных рецессий десны с комбинированным применением аутотрансплантата и аллогенной лиофилизированной dura mater: клинический случай
 Файл статьи
М. А. Носова1, Л. Т. Волова1, А. Н. Шаров2, Д.А. Трунин1, М. А. Постников1
Подробнее
Файл статьи
М. А. Носова1, Л. Т. Волова1, А. Н. Шаров2, Д.А. Трунин1, М. А. Постников1
Подробнее
-
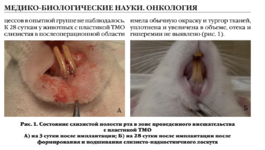
Эффективность применения аллогенной dura mater для превентивного хирургического лечения образования одиночных и множественных рецессий десны перед ортодонтическим лечением несъемной ортодонтической техникой: клиническое исследование
 Файл статьи
ПодробнееМ.А. Носова1, Д.Д. Березина3, Л.Т. Волова1, А.Н. Шаров2, Д.А. Трунин1, М.А. Постников1
Файл статьи
ПодробнееМ.А. Носова1, Д.Д. Березина3, Л.Т. Волова1, А.Н. Шаров2, Д.А. Трунин1, М.А. Постников1